Graphing transformations of functions is a simple, step-by-step process. Here are three general steps on how to master this process:
Step 1: Identify the graph’s parent function.
A parent function is the simplest form of a family of functions.
Some examples of parent functions are:

Identifying the parent function is simple – just look for any of these symbols (exponent, absolute value, root, fraction with x in the denominator) applied to the x-variable.
Now, we will graph the basic coordinates of the parent function and apply the transformations on those coordinates as we move through the process.
Step 2: Identify each transformation applied to the function.
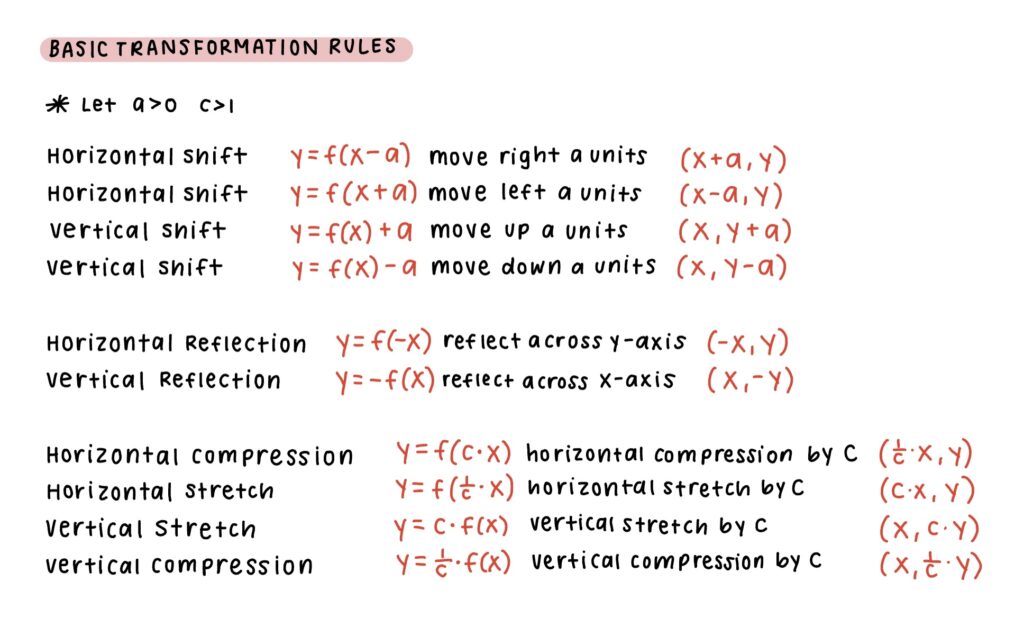
Always refer to these basic transformation rules:

Step 3: Graph each transformation one by one.
To avoid making mistakes, I recommend graphing each transformation on its own coordinate plane. This helps document each transformation and makes it easier to pinpoint silly mistakes.
There is a specific order that you must follow when graphing any type of transformed function.

I like to think of the phrase: work inside out. This means to do all of the transformations inside of the parentheses before working on the transformations outside of the parentheses (horizontal before vertical!).
You can stop here if you would like, but reading through the example below may help you understand the process a bit better.
